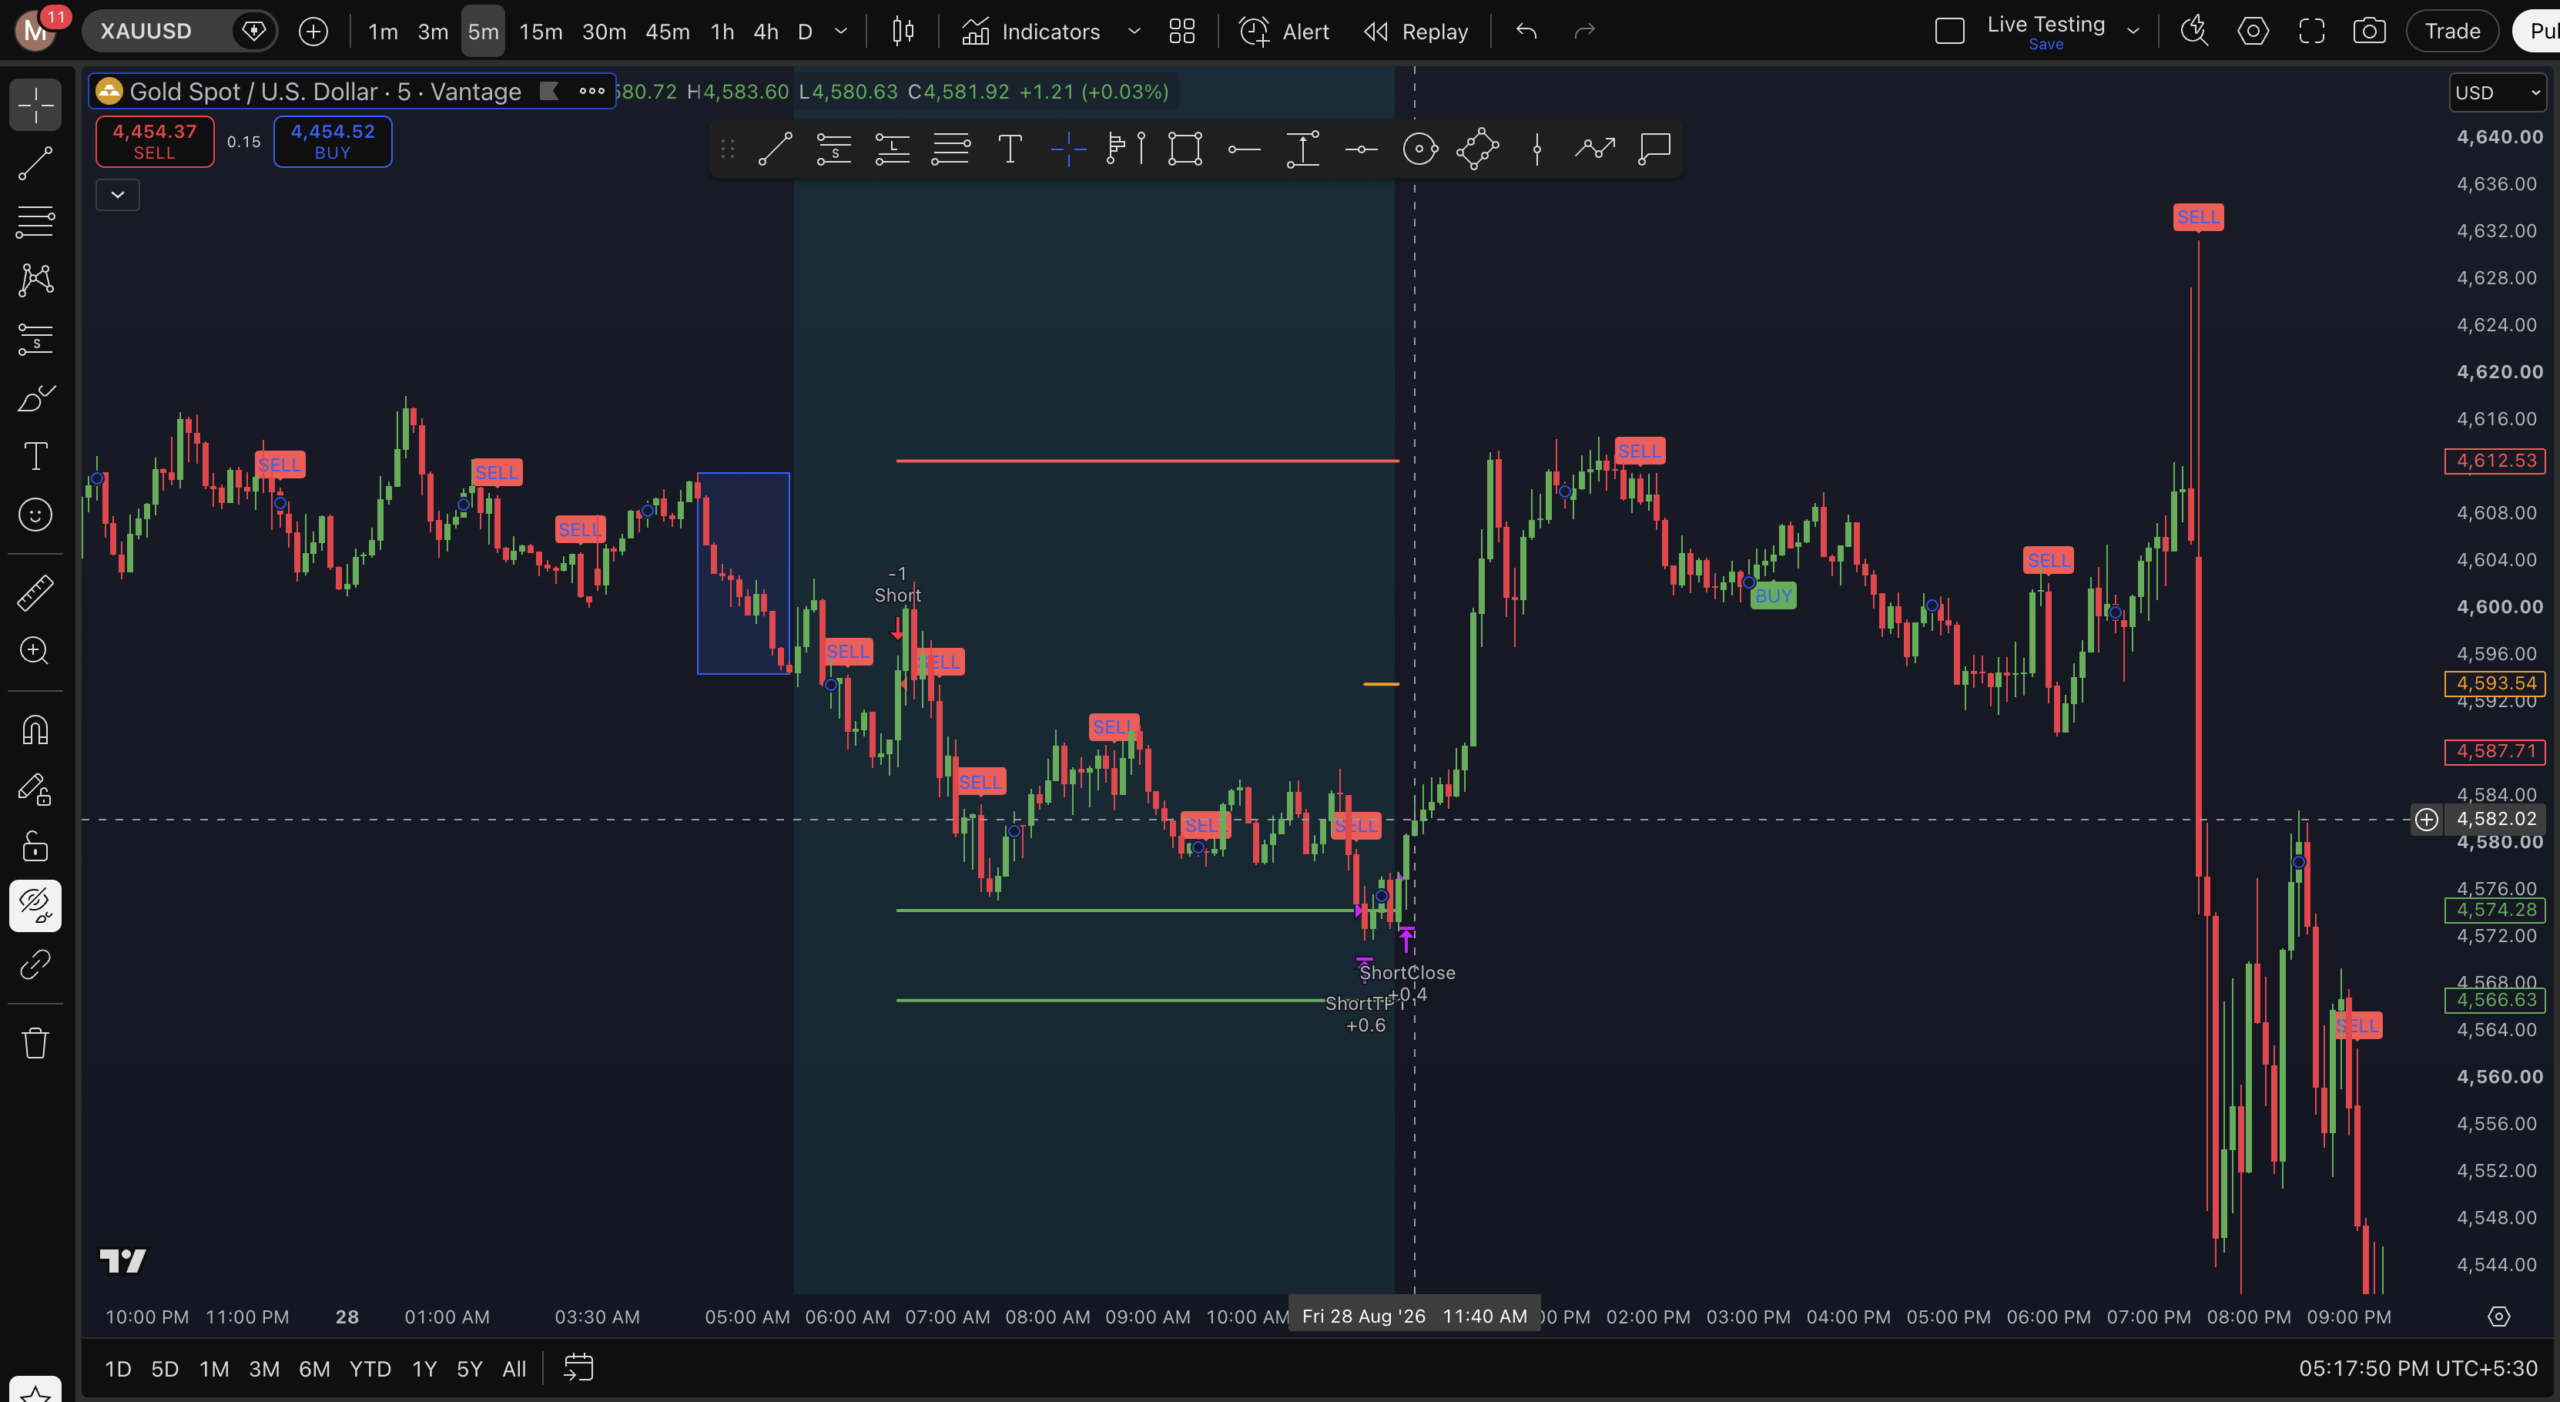
Gold (XAUUSD) showed a notable intraday price movement on the 5-minute chart, with the market initially gaining bullish momentum before facing resistance and entering a bearish retracement.
Key Resistance Levels
The chart highlights two important resistance zones:
- 4,649.48 – Immediate resistance
- 4,661.83 – Major resistance
A strong breakout above these levels, followed by confirmation, could indicate renewed bullish momentum and the possibility of further upside.
Intraday Price Action
During the highlighted trading session, XAUUSD moved higher from the lower levels and generated several BUY signals, eventually reaching the 4,640 area. However, the upward momentum weakened near the resistance zone.
Following the rejection, the market began forming a series of lower highs and lower lows, accompanied by multiple SELL signals. This indicates that sellers gradually gained control after the initial bullish move.
Support and Bearish Scenario
The 4,600 area can be considered an important short-term reference zone based on the price action shown in the chart.
If price breaks below this area with strong selling pressure, the bearish trend could potentially extend toward lower support levels.
On the other hand, a strong recovery from the support zone could bring buyers back into the market.
Bullish vs. Bearish Outlook
Bullish Scenario:
If XAUUSD breaks and sustains above the 4,649–4,661 resistance zone, it could signal a continuation of the bullish trend.
Bearish Scenario:
If price continues to face rejection near resistance and forms lower highs and lower lows, further downside pressure may develop.
Trading Takeaway
The chart demonstrates why traders should avoid relying solely on individual BUY or SELL signals. Combining price action, market structure, support and resistance, and confirmation candles can provide a more comprehensive view of the market.
For intraday trading, proper risk management, stop-loss placement, and position sizing remain essential, particularly when trading gold due to its high volatility.
Conclusion
Overall, the chart reflects an initial bullish move followed by a bearish reversal/retracement. The 4,649.48 and 4,661.83 levels are key resistance areas to monitor, while the 4,600 region is an important short-term reference point.
Traders should wait for clear breakout or rejection confirmation before considering a trade setup rather than entering solely on the basis of a single indicator or signal.
Disclaimer: This analysis is provided for educational and informational purposes only and should not be considered financial advice. Trading XAUUSD involves significant risk, and traders should always use appropriate risk management.
